
API Management (or APIM) allows listing APIs exposing operations. Its operations will be consumed via HTTP requests.
In order to retrieve the information related to the HTTP request, API Management implements several tools.
We will use Application Insights to trace the input and output information of successful and failed requests.
First, we’ll need to provision API Management and Application Insights in our resource group.
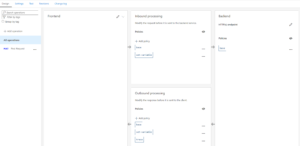
Then for our demo, we create an API called “TraceAPI” in the APIM. After that, we added a POST operation named “Post Request” in the “TraceAPI” API on which we’ll show the tracing.
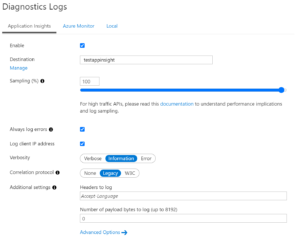
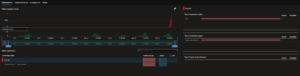
To enable logs in Application Insights, you must configure the API via the “Settings” section as shown below in the “Diagnostic Logs” section.
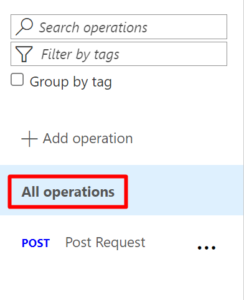
To analyze the traces informations in Application Insights, you must add the necessary information in the API via the section “policies”. For traces to be available in all operations, it is preferable to modify the policies in “All operations”.
Here is the code to add :
<policies>
    <inbound>
        <base />
        <set-variable name="requestBody" value="@{
            return context.Request.Body != null ? context.Request.Body.As<string>(preserveContent: true) : "";
        }" />
    </inbound>
    <backend>
        <base />
    </backend>
    <outbound>
        <base />
        <set-variable name="responseBody" value="@{
            return context.Response.Body != null ? context.Response.Body.As<string>(preserveContent: true) : "";
        }" />
        <trace source="SucceedInformation" severity="error">
            <message>SucceedInformation</message>
            <metadata name="Request.Body" value="@((context.Request.Body == null || String.IsNullOrEmpty((string)context.Variables["requestBody"])) ? "-none-" : (string)context.Variables["requestBody"])" />
            <metadata name="Response.Body" value="@((context.Response.Body == null || String.IsNullOrEmpty((string)context.Variables["responseBody"])) ? "-none-" : (string)context.Variables["responseBody"])" />
        </trace>
    </outbound>
    <on-error>
        <base />
        <set-variable name="requestBody" value="@{
            return context.Request.Body != null ? context.Request.Body.As<string>(preserveContent: true) : "";
        }" />
        <set-variable name="responseBody" value="@{
            return context.Response.Body != null ? context.Response.Body.As<string>(preserveContent: true) : "";
        }" />
        <trace source="ErrorInformation" severity="error">
            <message>ErrorInformation</message>
            <metadata name="Request.Body" value="@((context.Request.Body == null || String.IsNullOrEmpty((string)context.Variables["requestBody"])) ? "-none-" : (string)context.Variables["requestBody"])" />
            <metadata name="Response.Body" value="@((context.Response.Body == null || String.IsNullOrEmpty((string)context.Variables["responseBody"])) ? "-none-" : (string)context.Variables["responseBody"])" />
        </trace>
    </on-error>
</policies>
In this example, we recover the input body and the output response, both for successful or non-successful requests.
Code description
To continue, you must first define the input body in a “requestBody” variable, inside the “inbound” tag. It is the same case for the response, the variable has to be created in the “outbound” tag.
The “trace” tag allows you to obtain a trace information in Application Insights, you must define it directly in the code. We add a “message” tag to give it a name, and “metadata” tags to indicate the information to the logger.
Note that this information enabled the input/output logs to be obtained in the Application Insights.
In the case of an error request, the operation is similar, but the parameters must be defined in the “on-error” tag as in the example code above.
To analyze the traces information, we have to go to the App Insights connected to our API Management.
In this chapter, we will take an error request case. Note that the analysis of a successful request goes through the same operation.
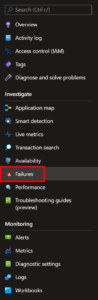
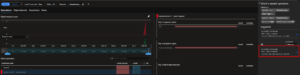
To start, go to the list of failed requests. To do this, click on “Failures” in the left menu.
Once in this menu and after making a call to our “Post Request” endpoint, in error, we get a failed request on the graph on the screen. You will also get an error by consuming your endpoint on your side.
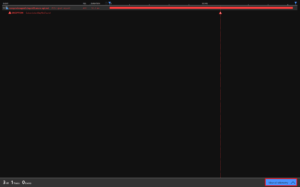
Click on the request in red, this will open a menu on the right. Click again on your request, but in this menu.
The details of the request are now visible on the screen. Click on “View all telemetry” at the bottom right to analyze your trace information defined in APIM.
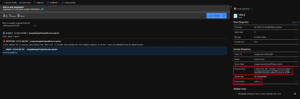
By clicking on the “ErrorInformation” trace information, the request body and response body are now visible from the right window.
We saw the tracing of information from an HTTP request to Application Insights in API Management. This keeps a constant follow-up on calls made to the APIM.
If you want more information about API Management, here are some links you should check :