
This article aims to show you how to build Power BI reports to supervise your Azure APIs using data collected from Azure Application Insights.
Azure Application Insights supplies a great deal of data about the use of APIs. All the technical data you might want can be found for each call. But as the number of APIs grows, and/or the APIs are used more and more, navigation becomes somewhat more laborious.
Thanks to Power BI reports, it is easy to obtain an overview of APIs’ status in real time and, if so wished, to investigate in Azure Application Insights if a problem occurs.
The first step is to go into Azure Application Insights to create the query that will be the source of our Power BI report:

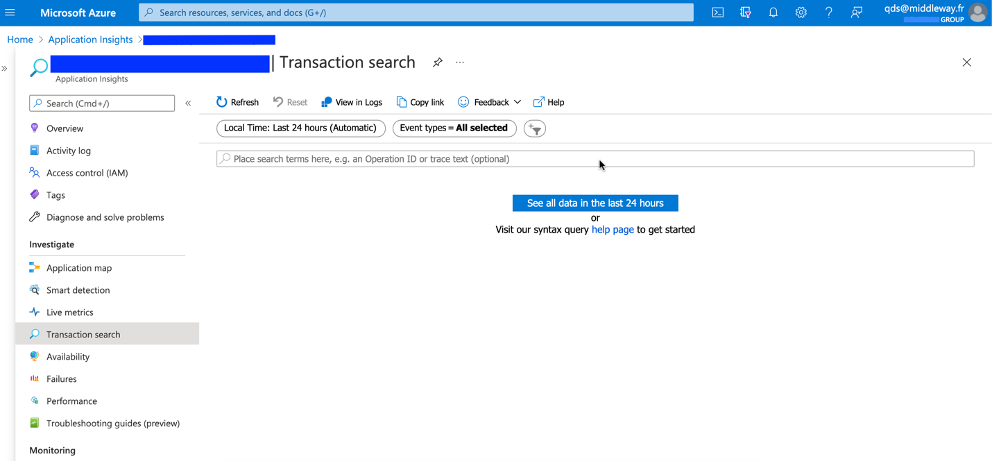
Then, using Application Insights’ filters and options, we need to select the data that we want to extract for our Power BI report. In our case, we want to retrieve all the requests sent to our three Leads, Distributors and Models APIs within 30 days of the current date. The configuration below shows how this can be achieved.

By clicking on![]() , Azure generates a query in the Kusto language:
, Azure generates a query in the Kusto language:
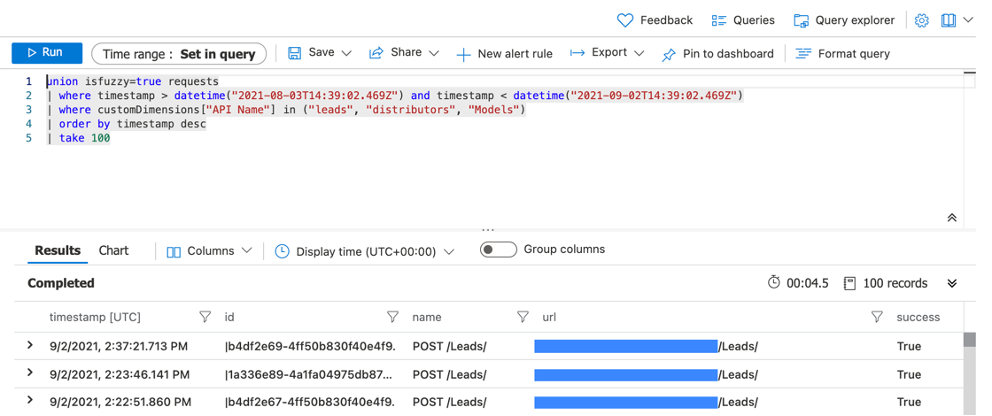
At this stage, it is possible to customize the query to meet our requirements more precisely. We in fact want to retrieve all the requests sent to our APIs. We therefore remove the “take 100” part from the query. In addition, we want to retrieve the requests made within 30 days of the current date, and not between two given dates, which is how the query works by default. We therefore replace
![]()
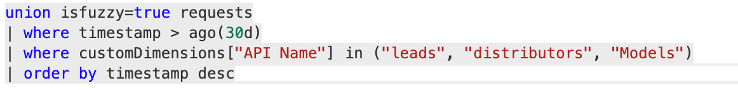
with
![]()
This last point is important for the last step, which is the automatic data refresh.
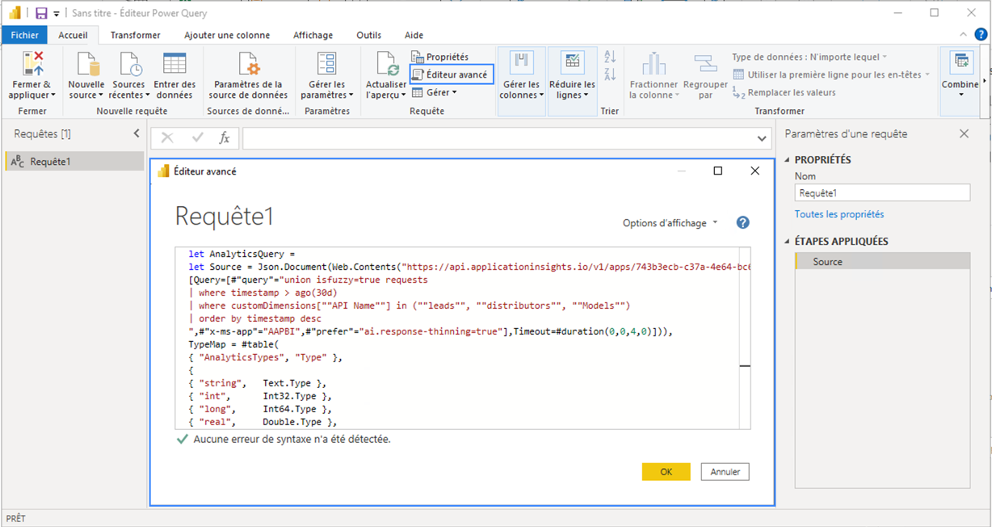
Our edited query is consequently as follows:
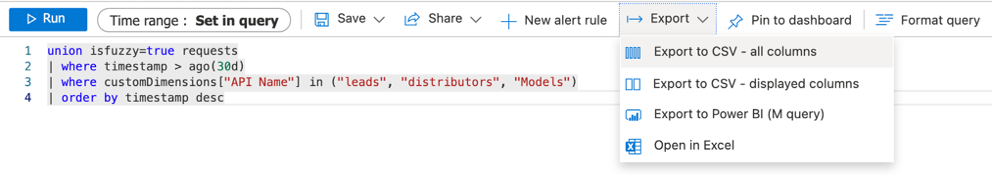
To extract the query obtained in the section above, go into Export > Export to Power BI (M query).
You will then obtain a text file containing the query in the right format.
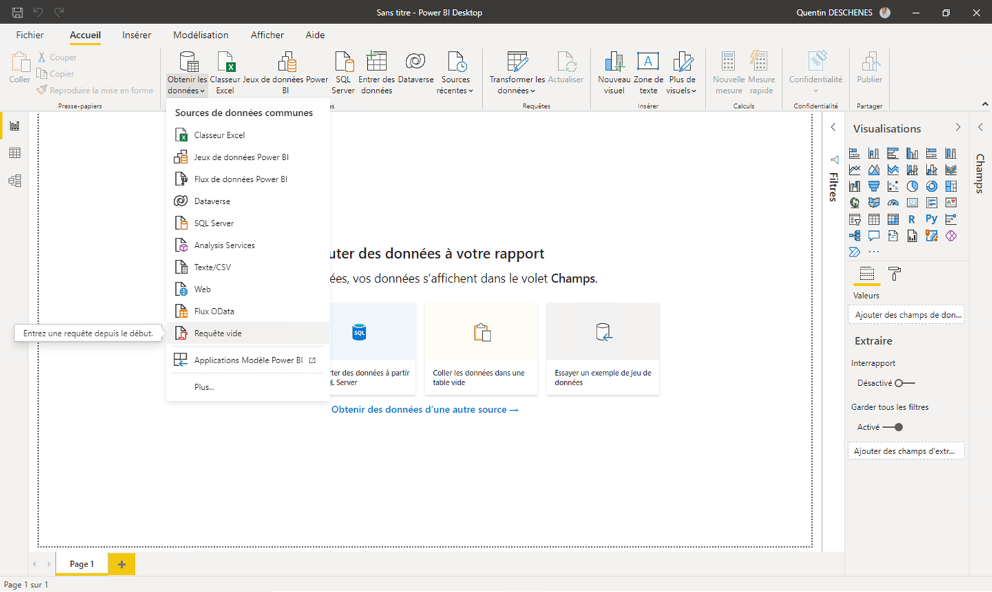
For the next step, go into Power BI Desktop. We need to create a new report, selecting “Blank query” as the data source.
Then go into “Advanced editor” and copy-paste the query obtained in Azure:
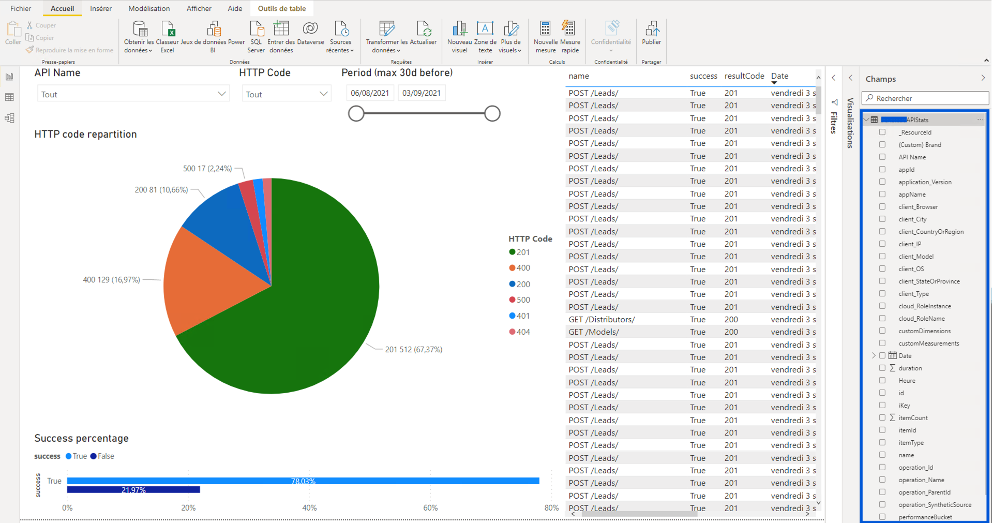
As a result, we have all the data available in our Power BI that we had in Azure Application Insights. It is then possible to build reports to suit project needs. In our case, we will filter on three different fields, i.e. API name, HTTP return codes, and dates. On the basis of these three filters, all reports are updated. The central graph shows at a glance whether or not there are many errors.
Lastly, by clicking on error code 500 in the Leads API, for example, the technical details can be seen in the table on the right where, among other things, the request ID is shown. It is then a simple matter to find the request in question in Azure and investigate.
Lastly, as mentioned in the introduction, it is possible to configure an automatic refresh of these data in Power BI. The report first needs to be published online in the Power BI service. In this way, the report will display data on your APIs for the 30 days before the current date. For this last step, go into Power BI online. Then go into your workspace. You should find the report and the dataset on which the report is based.
Click on the following icon for the dataset:
![]()
In the “Scheduled refresh” area, it is then possible to set the times when you want the data to refresh.
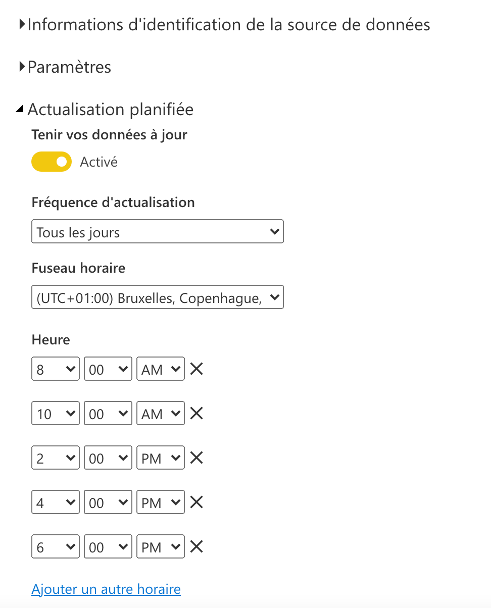
It is easy to see the date and time that the dataset was last updated, as well as the next scheduled refresh.

It can be seen that, by following this procedure, it is relatively easy to create and customize a dynamic Power BI report based on data from Azure. This has a number of advantages for us. We can, for example, track changes in consumption of the services we develop for our customers. We can also use these reports to monitor interfaces, in addition to the solutions offered by Azure itself. Lastly, and for me one of the most important uses, we can share quantified, relevant data with our customers, formatted in a way that is easy to understand and analyze.