
In most software projects, discussions tend to focus heavily on features, deadlines, and production releases. Code quality, on the other hand, is discussed far less often. Yet it is a topic that can very quickly become central. Poorly structured code, riddled with small imperfections or duplications that have lingered for months, almost inevitably ends up slowing teams down and weighing heavily on deliveries. Conversely, when time is taken to establish a quality-driven approach, everything changes: bugs reappear less frequently, developers gain peace of mind, and updates become more predictable.
It is within this mindset that SonarQube fits in, an tool that has established itself as a kind of automatic safeguard within development pipelines.
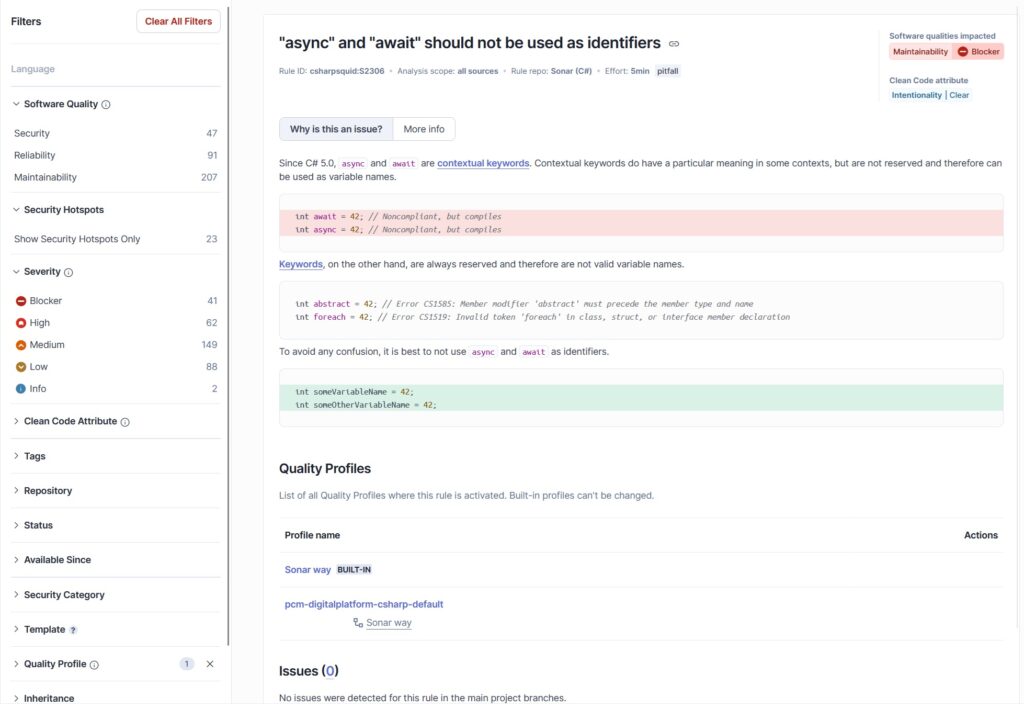
SonarQube is not just another static code analyzer. It is a tool capable of dissecting a project from multiple angles: vulnerability detection, identification of bad practices, complexity analysis, duplication tracking, and more. The platform combs through your code and returns precise indications of what deserves attention.
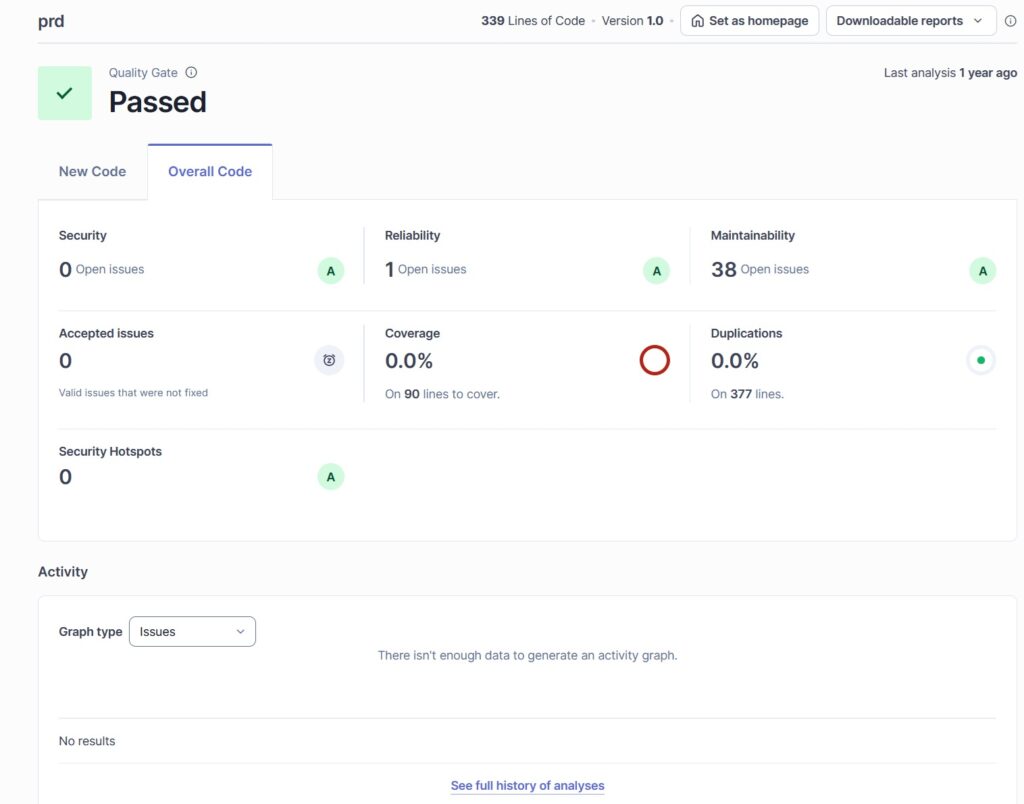
What makes it particularly powerful is its ability to operate continuously. Once installed, it requires very little ongoing attention: it analyzes, flags issues, raises alerts, and translates the state of the project into clear indicators. The interface plays a major role here, with visualizations and dashboards that provide an immediate sense of the codebase’s overall health.
Depending on the languages used and the chosen configuration, SonarQube can highlight different types of issues. Among the most valuable insights are:
The value does not lie solely in detection. SonarQube also classifies and prioritizes issues, which prevents teams from being overwhelmed by alerts and allows them to focus first on what truly matters.

Many teams already use CI/CD pipelines to automate testing or deployments. Integrating SonarQube into this process adds an extra layer of control.
Here, the principle is straightforward: with every commit, push, or merge request, the pipeline triggers an analysis. The state of the code then becomes immediately visible, without any manual intervention.
The benefits are very tangible:
This continuous integration brings overall consistency to the project. The quality no longer depends on individual vigilance or goodwill, but on an automated and repeatable process.

Installing SonarQube is not particularly complex, but a few steps are required.
Depending on the needs, the tool can be deployed on an internal server, via Docker, or as a cloud service (or even a combination of these). Once the instance is up and running, all that remains is to install the appropriate scanner for the project’s language or environment. A small configuration file then specifies which directories should be analyzed, which should be ignored, and which parameters to apply.
Once everything is ready, the analysis command simply needs to be integrated into the CI/CD pipeline. At each run, the analysis results are automatically published to the interface: number of detected bugs, complexity, estimated technical debt, quality trends over time, all available at a glance.
As the official documentation is particularly clear and well structured for step-by-step setup, here are the most relevant links for a “from scratch” initialization:
SonarQube Cloud – Analyzing projects on Azure DevOps
https://docs.sonarsource.com/sonarqube-cloud/getting-started/azure-devops
SonarQube IDE for Visual Studio
https://docs.sonarsource.com/sonarqube-for-visual-studio/getting-started/installation
Setting up an enterprise portal (multi-project management)
https://docs.sonarsource.com/sonarqube-cloud/getting-started-with-enterprise/setting-up-your-enterprise
Configuring quality standards (Quality Gates, New Code, rules)
https://docs.sonarsource.com/sonarqube-cloud/standards/about-new-code
Integrating Sonar analysis into an Azure DevOps CI pipeline
https://docs.sonarsource.com/sonarqube-cloud/advanced-setup/ci-based-analysis/azure-pipelines/setting-up-project-integration
Global SonarQube documentation
https://docs.sonarsource.com/
Adopting SonarQube is not about adding an extra constraint. Rather, it is a way to make existing practices more reliable, without changing how teams work day to day. The tool identifies weaknesses in the code before they reach production and gradually encourages teams to adopt cleaner, more consistent practices.
In a context where development cycles keep accelerating, having a tool capable of continuously monitoring code quality becomes almost indispensable. SonarQube fits naturally into this dynamic: discreet in its operation, yet remarkably effective at keeping a codebase healthy over the long term.