Fabric is Microsoft’s new end-to-end data platform. It combines several tools like Azure Synapse Analytics, Data Factory, and Power BI. This allows for the integration, transformation, analysis, and visualization of data in one place, making collaboration among data specialists easier.
Power BI is Microsoft’s suite of services and tools dedicated to data visualization. Previously, there was a Power BI Desktop version, which ran locally and was primarily used for development. Then, Power BI Service, an online platform, was used to publish and share dashboards and manage security.
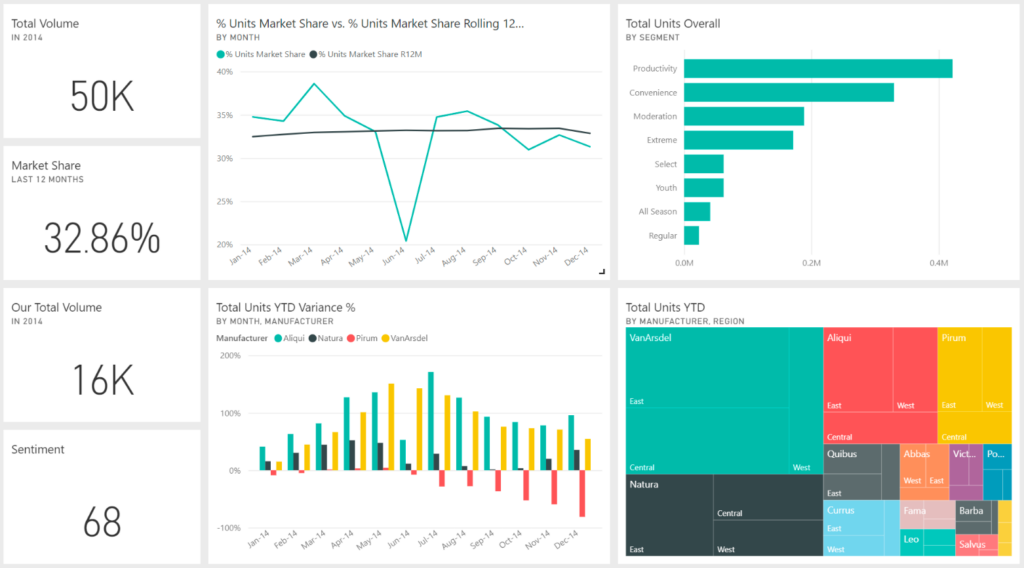
Regular users of Azure Synapse Analytics, Data Factory, and Power BI will find familiar interfaces in Fabric. For example, the DataFlow Gen 2 component’s interface is the same as Power Query in Power BI. The data pipelines are also based on Data Factory pipelines, and the notebooks used in Synapse Data Engineering are identical to those in Synapse Analytics.
The main languages used are still SQL for data warehousing, Python for data integration and analysis via notebooks, M language for data transformation in Dataflow Gen 2, and DAX for creating measures in Power BI.
That said, Fabric also offers a low-code experience that simplifies the work:
As mentioned earlier, having all components in one place improves efficiency in terms of organization, resource consumption, and collaboration. The entire BI architecture is in the same place, divided into layers according to a medallion architecture (bronze, silver, and gold layers).
This ensures better data management.
One of Fabric’s main strengths is OneLake. This data lake, described as the “OneDrive for data,” makes data stored here directly visible to all components. This optimizes resources and data interoperability, avoiding duplication or data movement.
In Fabric, the continuous integration and deployment of semantic data models and reports can be improved using Azure Git and Fabric deployment pipelines. No more duplicate reports scattered everywhere and suboptimal sharing in SharePoint!
DataFlow Gen2, similar to Power Query in Power BI, is the low-code “ETL” component of Fabric, which allows extracting, transforming, and then loading data ready for visualization. The advantage is that it’s already in the cloud, so there’s no need to download a semantic data model locally, transform the data, and re-upload it as with Power Query.
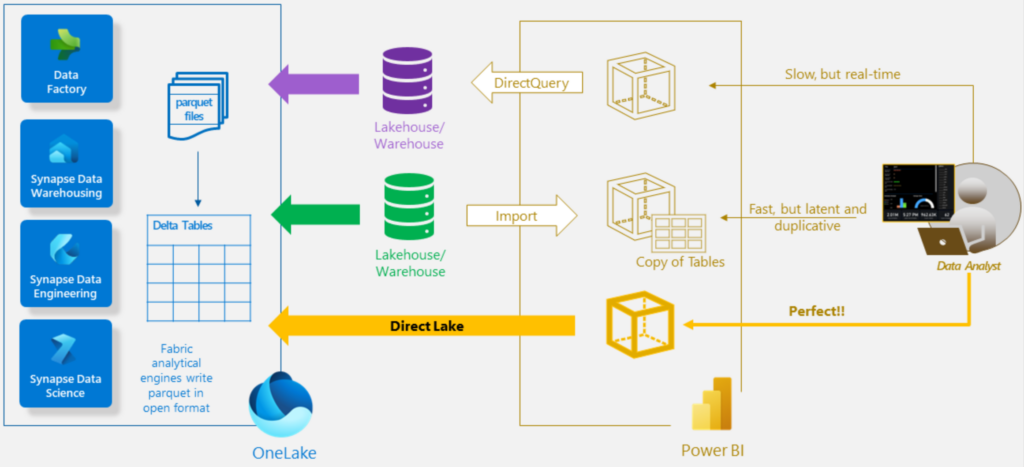
In Power BI, the most common modes for connecting to data sources are Import mode and Direct Query mode.
In Import mode, data is cached for better performance, especially with large data models. However, source changes are only captured upon refresh.
In contrast, Direct Query retrieves data from the source, which can be slower but reflects source changes immediately. However, data transformations in Power Query are limited in this mode.
In Fabric (and with a Microsoft Premium license outside of Fabric), data is loaded directly from OneLake. This offers performance similar to Import mode while reflecting real-time changes in the source. Ideal for large models and frequently updated models (source: Microsoft).
Microsoft Fabric offers several capacity purchasing options. Capacities are measured in Stock Keeping Units (SKU). Each SKU has a different computing power, measured by its capacity value (CU).
There are two types of SKUs:
To use Fabric, you need an F or P license and at least one license per user.
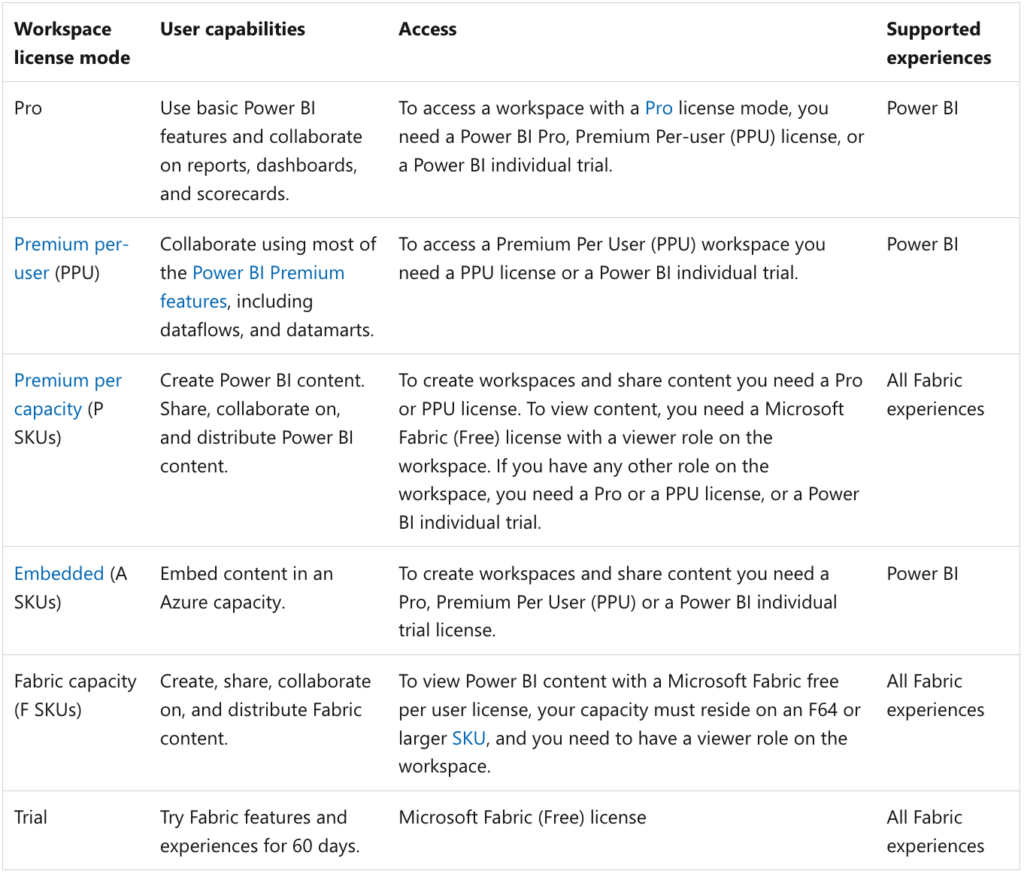
Capacities are assigned to workspaces in Fabric based on the workspace’s licensing mode. Here’s a table provided by Microsoft summarizing this concept:
A capacity is a set of resources for a given use. Each capacity offers a number of SKUs based on the necessary computing power, measured in Capacity Units (CU). Below is another table from Microsoft that illustrates the relationship between Fabric SKUs, CU, Power BI SKUs, and Power BI virtual cores.
It’s important to note that Power BI Premium P SKUs support Microsoft Fabric. The A and EM SKUs only support Power BI components.
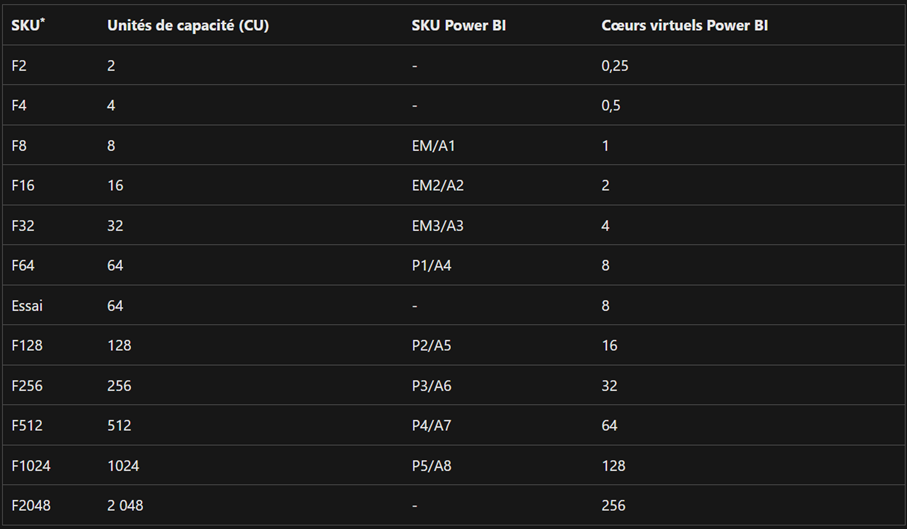
*SKUs below F64 require a Pro or Premium Per User (PPU) license, or an individual free Power BI trial, to consume Power BI content.
And here are the costs of these licenses as of July 2024, either by consumption or by reservation:
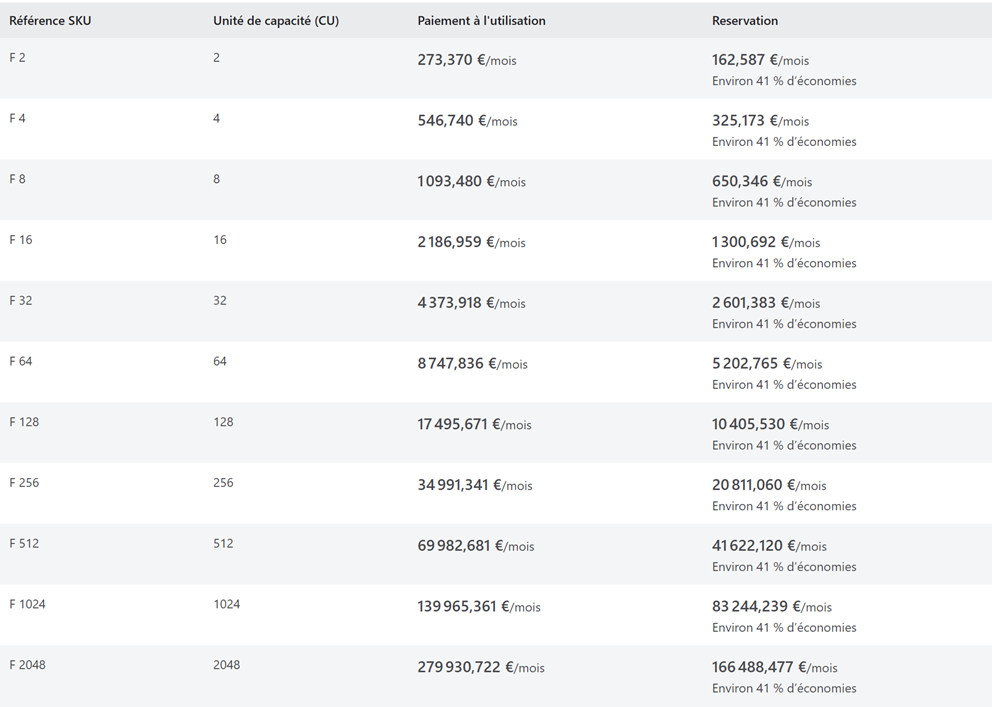
More information about costs here: Fabric Pricing
However, this license only provides access to Power BI components within Fabric.
Here are the features for each license level in this table from Microsoft:
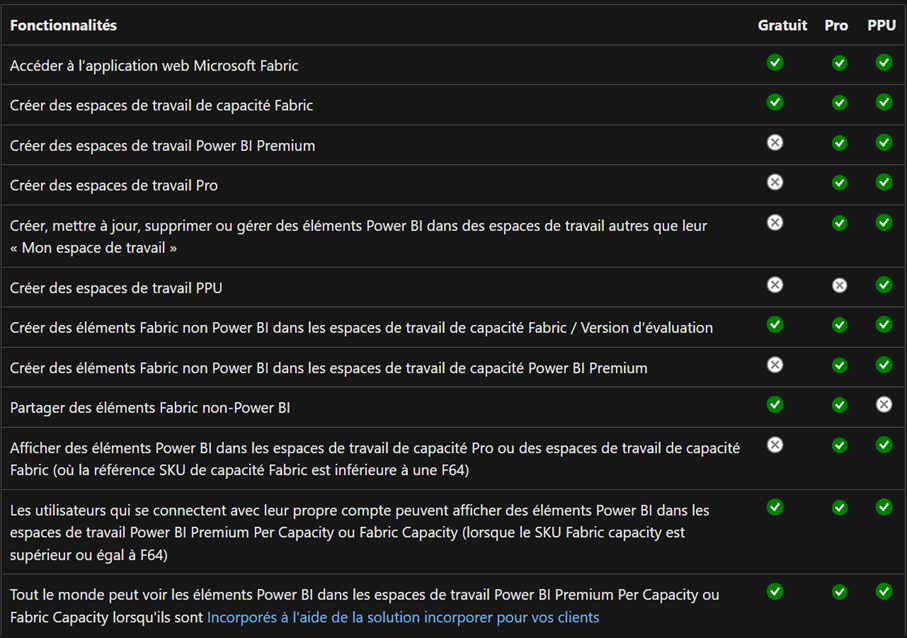
In conclusion, using Power BI within Microsoft Fabric allows you to consume centralized data from OneLake. It also provides better data management and improves collaboration among different data specialists, while optimizing resources and associated costs.